Arquivos
Categorias
- arquitetura da informação
- artigo
- cinema
- classificação
- comunicação
- conhecimento
- design da informação
- estéticas tecnológicas
- fotografia
- games
- imagem
- literatura
- mapa
- metadados
- navegação
- pos-modernidade
- pragmatismo
- processing
- semiotica
- sistemas dinâmicos
- sociedade da informação
- tags
- TIDD
- trabalho
- Uncategorized
- vida urbana
- visualização
- Walter Benjamin
Super Mario Galaxy 2
Comprei um Wii. Por que demorei tanto? Estava tentando me manter adulto, gastando dinheiro com contas chatas e burocráticas.
Ainda não comprei esse jogo aí de cima, justamente porque meu lado adulto ainda acha proibitivo gastar R$250,00…
Desacostumei com video games. Na época do NES, a long long time ago, era comum alugar cartuchos para jogar no final de semana. Pena que não era possível salvar os jogos, com exceção dos que tinham opção de password.
Publicado em games
Deixe um comentário
The hidden influence of social networks
Se tiver um tempo, veja até o final. Aborda muitas coisas interessantes, principalmente a influência das redes sociais em nosso comportamento, nossas emoções ou mesmo em nossa condição física. O que me agrada muito nesses estudos, além disso, são as referências às propriedades emergentes e teoria dos sitemas dinâmicos (o conjunto é maior do que a soma das partes individuais).
Publicado em mapa, sistemas dinâmicos, visualização
Deixe um comentário
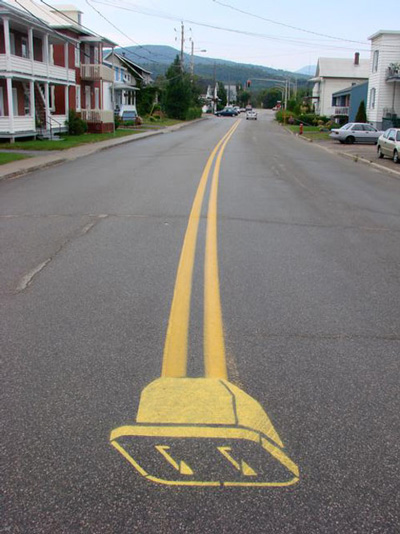
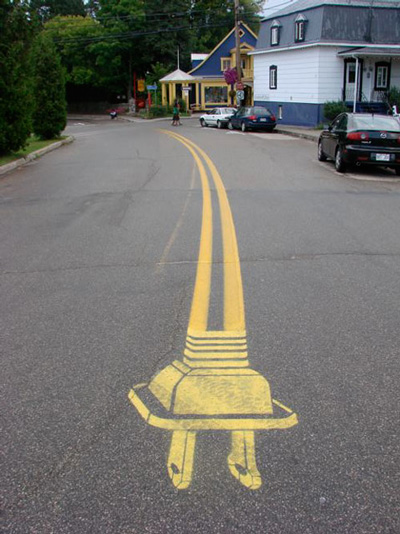
Roadsworth
Roadsworth: Crossing the Line details a Montreal stencil artist’s clandestine campaign to make his mark on the city streets.
Hailed as an “artist’s artist” by Wooster Collective, Roadsworth began to play with the language of the streets, overlaying city asphalt markings with his own images: a crosswalk becames a giant boot print, vines choked up traffic dividers, and electrical plugs filled parking spots. Each piece begged the question, Who owns public space?
As he is prosecuted at home and celebrated abroad, Roadsworth struggles to defend his work, define himself as an artist and address difficult questions about art and freedom of expression.


Publicado em vida urbana
Deixe um comentário
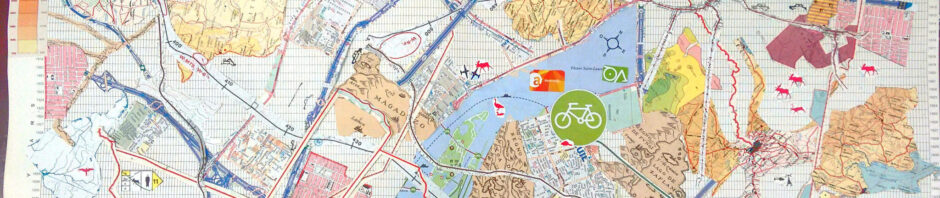
Data Flow 2: Visualizing Information in Graphic Design

International interest in the sophisticated and aesthetic visualization of complex information made Data Flow a bestseller. Today, more and more graphic designers, advertising agencies, motion designers, and artists work in this area. New techniques and forms of expression are being developed. Consequently, the demand for information on this topic has grown enormously.
Data Flow 2 expands the definition of contemporary information graphics. The book features new possibilities for diagrams, maps, and charts. It investigates the visual and intuitive presentation of processes, data, and information. Concrete examples of research and art projects as well as commercial work illuminate how techniques such as simplification, abstraction, metaphor, and dramatization function. The book also includes interviews with experts such as The New York Times’s Steve Duenes, Infosthetics’s Andrew Vande Moere, Visualcomplexity’s Manuel Lima, ART+COM’s Joachim Sauter, and passionate cartographer Menno-Jan Kraak as well as text features by Johannes Schardt about the challenges in creating effective information graphics and about the relationship between complexity, clarity, content, and innovation.
Offering practical advice, background information, case studies, and inspiration, Data Flow 2 is a valuable reference for anyone working with or interested in information graphics.
Fonte: Gestalten
Aqui há um review sobre o livro. Vejam alguns exemplos:
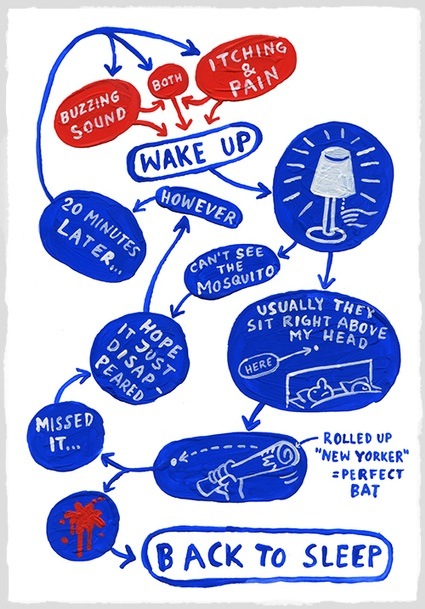
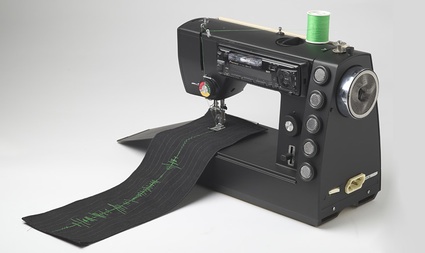
(essa é demais: uma máquina de costura que converte som em forma de linha no pano.)
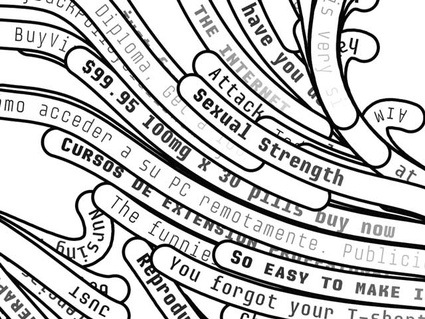
(wallpaper generativo feito com subjects de spams)
Publicado em design da informação, estéticas tecnológicas, mapa, visualização
Deixe um comentário
5th Symphony graphical score animation

Vi no blog do Fernando, um cara muito culto.
Publicado em design da informação, visualização
Deixe um comentário
Pictogramas olímpicos
Ok, Atenas e Pequim são bonitos, mas ainda acho Munique melhor. Veja mais aqui.
Publicado em design da informação
Deixe um comentário
Visualization of cultural data sets
We believe that a systematic use of large-scale computational analysis and interactive visualization of cultural data sets and data streams will become a major trend in cultural criticism and culture industries in the coming decades. What will happen when humanists start using interactive visualizations as a standard tool in their work, the way many scientists do already? If slides made possible art history, and if a movie projector and video recorder enabled film studies, what new cultural disciplines may emerge out of the use of interactive visualization and data analysis of large cultural data sets?
Só para variar, o que esse cara tem dito me interessa muito. Vejam mais algumas referências aos estudos de “cultural analytics” desenvolvidos pelo Manovich.
Subway Maps

… think about subway maps, which are abstracted from the complex shape of the city and are focused on the rider’s goal: to get from one place to the next. Limiting the detail of each shape, turn, and geographical formation reduces this complex data set to answering the rider’s question: “How do I get from point A to point B?”
Harry Beck invented the format now commonly used for subway maps in the 1930’s, when he redesigned the map of the London Underground. Inspired by the layout of the circuit boards, the map simplified the complicated Tube system to a series of vertical, horizontal and 45o. diagonal lines. While attempting to preserve as much of the relative physical layout as possible, the map shows only the connections between stations, as that is the only information that riders use to decide their paths.
Esse trecho está no livro da coruja do Ben Fry.
Veja também alguns mapas do transporte de Londres.
Publicado em design da informação, mapa
Deixe um comentário
Espaço de informação
Vídeo de divulgação de um novo produto do Google.
Agora, alguns trechos do Manifesto sobre as Mídias Locativas, do André Lemos.
Mídia Locativa. Tecnologias e serviços baseados em localização (LBT e LBS) cujos sistemas infocomunicacionais são atentos e reagem ao contexto. Ação comunicacional onde informações digitais são processadas por pessoas, objetos e lugares através de dispositivos eletrônicos, sensores e redes sem fio. Dimensão atual da cibercultura constituindo a era do “ciberespaço vazando para o mundo real” (Russel, 1999), a era da “internet das coisas”. (…)
6. Estamos na era da computação ubíqua e pervasive (Weiser), ou seja da informática em todos os lugares e em todas as coisas. Mas não há tecnologias sensíveis e nenhuma delas está atenta a contextos! Elas estão em tudo e em todos os lugares, mas não sabem o que é um contexto e nem tem capacidades de sentir o local.
7. Depois do upload para a Matrix lá em cima, a internet 1.0, agora é a vez do “download do ciberespaço”, da informação nas coisas aqui em baixo, a internet 2.0. Não se trata mais do virtual lá em cima, mas do que fazer com toda essa informação das coisas e dos lugares aqui de baixo! Como nos relacionamos com as coisas e com os lugares? E agora, com essas coisas e lugares dotados de informação digital e conexão à internet?
Publicado em estéticas tecnológicas, sociedade da informação, tags, vida urbana
Deixe um comentário